Social media reports are integral to monitoring your brand’s growth and informing your content strategy.
But when it comes to sharing the month’s results with your boss, clients, or other teams, it can be hard to know what to include.
Unlike the detailed spreadsheet or tracker you use, social media reports need a high-level overview of what worked and what didn’t, along with whether you’re hitting your goals.
relationship status:
— Later (@latermedia) December 3, 2021
⚪️ single
⚪️ taken
⚪️ it’s complicated
🔘 doing my monthly report
In other words, your social media report should be detailed enough to get you kudos, yet streamlined enough to keep it engaging.
Enter: Later’s Social Media Report Template.
With it, you can include your most important metrics, key learnings, and wins. It's perfect for presentations, client updates, or cross-team sharing.
Plus, the template comes with an example report, so you have a guide for filling it out.
So, if you’re a social media manager, freelancer, entrepreneur, or anyone managing a brand online, this template is for you. Download it now — for free!
Table of Contents
What Is a Social Media Report? (+ What to Include)
A social media report shows how your brand’s social media content is performing across multiple social channels like Instagram, Facebook, YouTube, TikTok, and more.
These reports should be clear, precise, and include relevant insights about everything you’ve posted — whether it's monthly, quarterly, or yearly.
me at the end of every month: oh, so we're doing this report thing again. 🤨
— Later (@latermedia) May 29, 2022
Depending on your goals, what you include in your social media report will vary.
However, most will have the following metrics:
Posts: Best-performing posts of the month
Key learnings: Wins, challenges, trends, and opportunities
Numbers: Follower growth, posts published, reach, engagement, link clicks, video views, sessions, spend, and month-over-month percentage increase or decrease
The bulk of your time should be spent on your key learnings and opportunities:
What do the numbers reveal about your content strategy?
What do they reveal about your audience?
Have you run any experiments or major campaigns? How did they affect your performance?
Is it a certain time of the year? For example, summers may be generally slow for you.
What key takeaways can you implement for the following weeks or month?
Truly understanding how (and why) your content performs the way it does is key to building a successful social media strategy for your business.
P.S. Later's social media management tools are trusted by 7M+ marketers, creators, and brands to plan, schedule, and analyze their content. Sign up today — for free.
How to Access Analytics to Create a Social Media Report
To create a great social media report, you first need to get a grasp on your analytics.
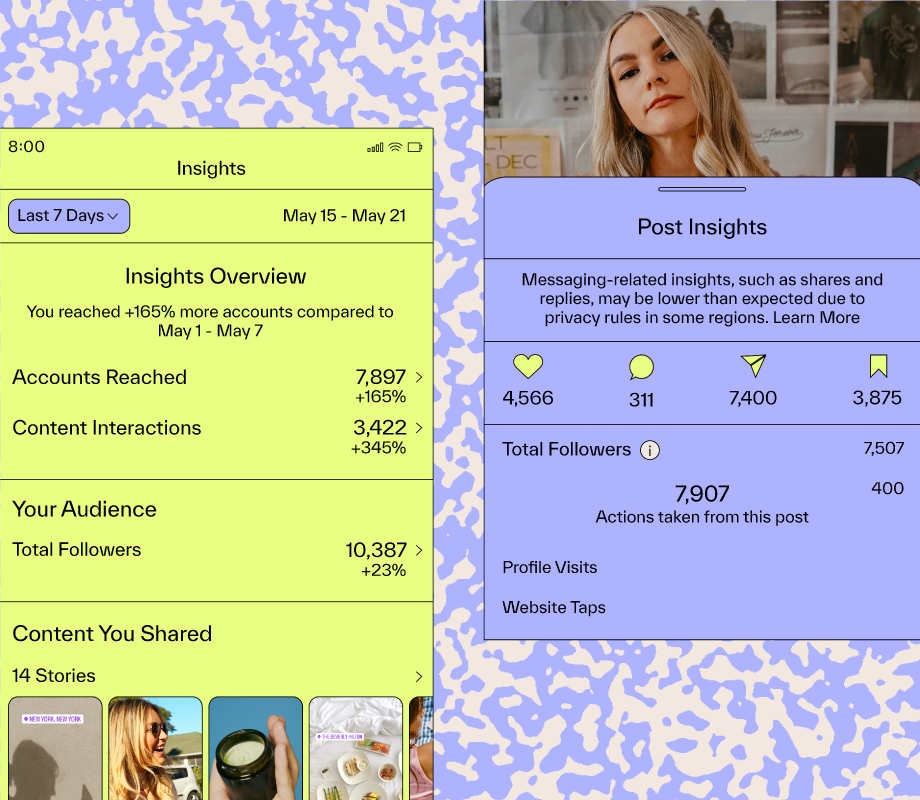
Most social media platforms (like Instagram) have built-in analytics tools you can use to discover your weekly numbers, which you can then manually track in a spreadsheet.

However, with a third-party tool like Later, you’ll have an easier way to glean these insights — plus, more in-depth data too.
Later’s Analytics dashboard is easy-to-interpret, and lets you navigate different tabs including Post Performance.
This way, you can filter by different metrics including engagement, followers, reach, likes, and more:
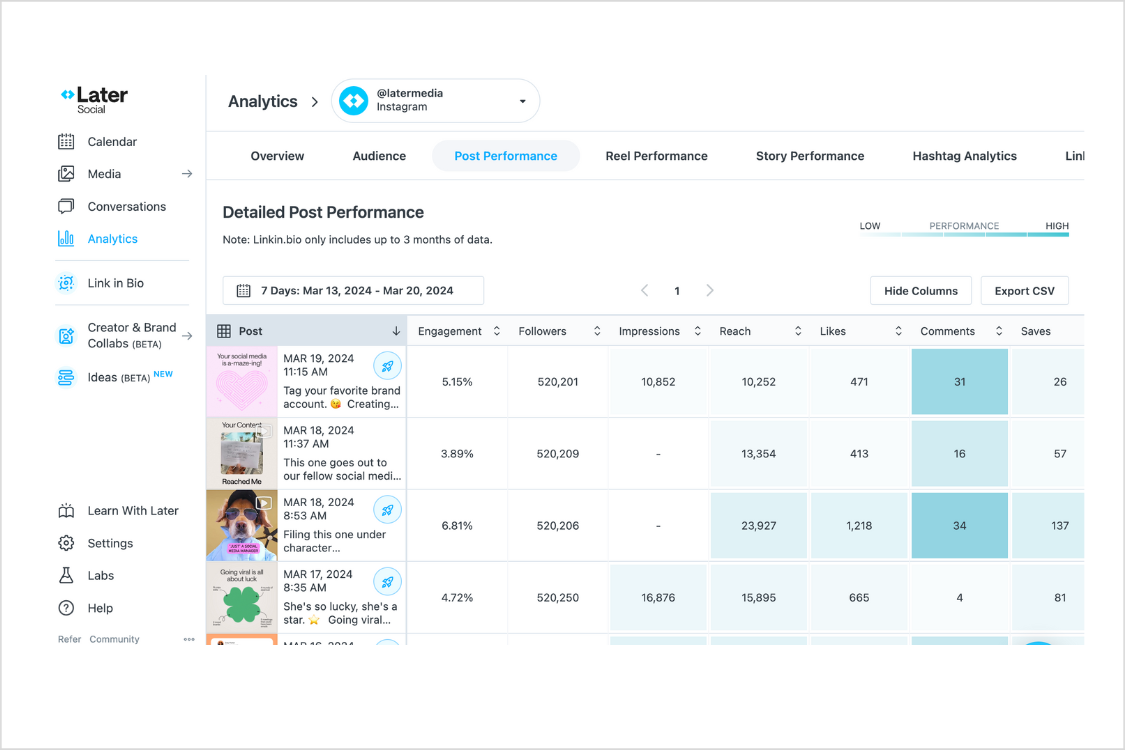
Plus, you can export your Instagram analytics directly to your desktop (in a CSV file) making it easy to keep all of your numbers in spreadsheet format.
Then, when you're ready to create your social media report, use this data and spotlight the most relevant metrics for your boss, team, or clients.
Access in-depth details about the performance of your social media posts with Later's Analytics feature. Create an account today.
Best Practices for Building Your Social Media Report in 2024
When building your social media report in 2024, keep these two best practices in mind:
Identify Your Social Media Goals
Focus on the Insights That Matter
Best Practice #1: Identify Your Social Media Goals
Your social media goals will set the stage for what’s included in your monthly report.
The most effective goals are those that are SMART:
Specific: Include specifics to help you track the success of your content.
Measurable: The goal has to be measured in some way. This is where your key metrics come into play.
Achievable: Is this goal in scope? Your goals should be challenging, but still within reach.
Relevant: Is this goal working towards achieving your larger business objectives?
Time-sensitive: What is the timeline for this goal?
TIP: For help creating SMART goals, read this blog — How to Set Social Media Goals (+ Free Course)
Once you know your goals, you can set clear benchmarks to measure your performance against.
This way, if you’re over or underperforming, you can adjust your strategy as needed.
Best Practice #2: Focus on the Insights That Matter
Real talk: people tend to doze off when it comes to talking numbers, so you’ll want to keep things concise.
This is your chance to highlight your wins, show how you’re supporting business goals, and point out trends or opportunities.
how i find the metrics for my monthly report is between me and god
— WorkInSocialTheySaid (@WorkInSociaI) November 3, 2021
Remember: this is a monthly social media report. Unlike your quarterly or yearly analysis, this report should be much more succinct.
It’s about showing high-level results, drawing insights, and making sure your strategy is on the right track.
ICYMI: Later’s social media scheduling tools help brands and marketers manage their content, plan posts in advance, and analyze their performance. Sign up now.
How to Create a Monthly Social Media Report in 2024
Now for the fun part! It’s time to create your social media report.
To help, we’re going to walk you through the main sections of our free reporting template.
Similar to PowerPoint, this Google Slide can be edited at your leisure. You can duplicate or remove slides, change background colors, use our PNG stickers, and add your data insights.
Once you’re done, delete the example report slides, and voila — you’re ready to present your findings.
TIP: To share your report in PDF form, simply save the Google Slide as a PDF instead.
So what are you waiting for? Start using our Social Media Report Template now!
Step #1: Choose Which Metrics You’ll Report On
Remember: your monthly report is all about sharing a high-level check-in.
So, with your social media goals in mind, choose which metrics you’ll report on for each platform.
For example, if you’re looking to build awareness, your follower growth, reach, and engagement will be important metrics to track.
However, if you’re trying to drive people to your website, you’re going to focus a lot more on link clicks and conversions.
This will help you frame and fill out the report — including whether you’re on pace to hit your monthly, quarterly, and yearly goals.
Step #2: Include a High-level Overview of Your Progress
Right off the bat, you’ll want to include a snapshot of your progress with a monthly check-in slide:
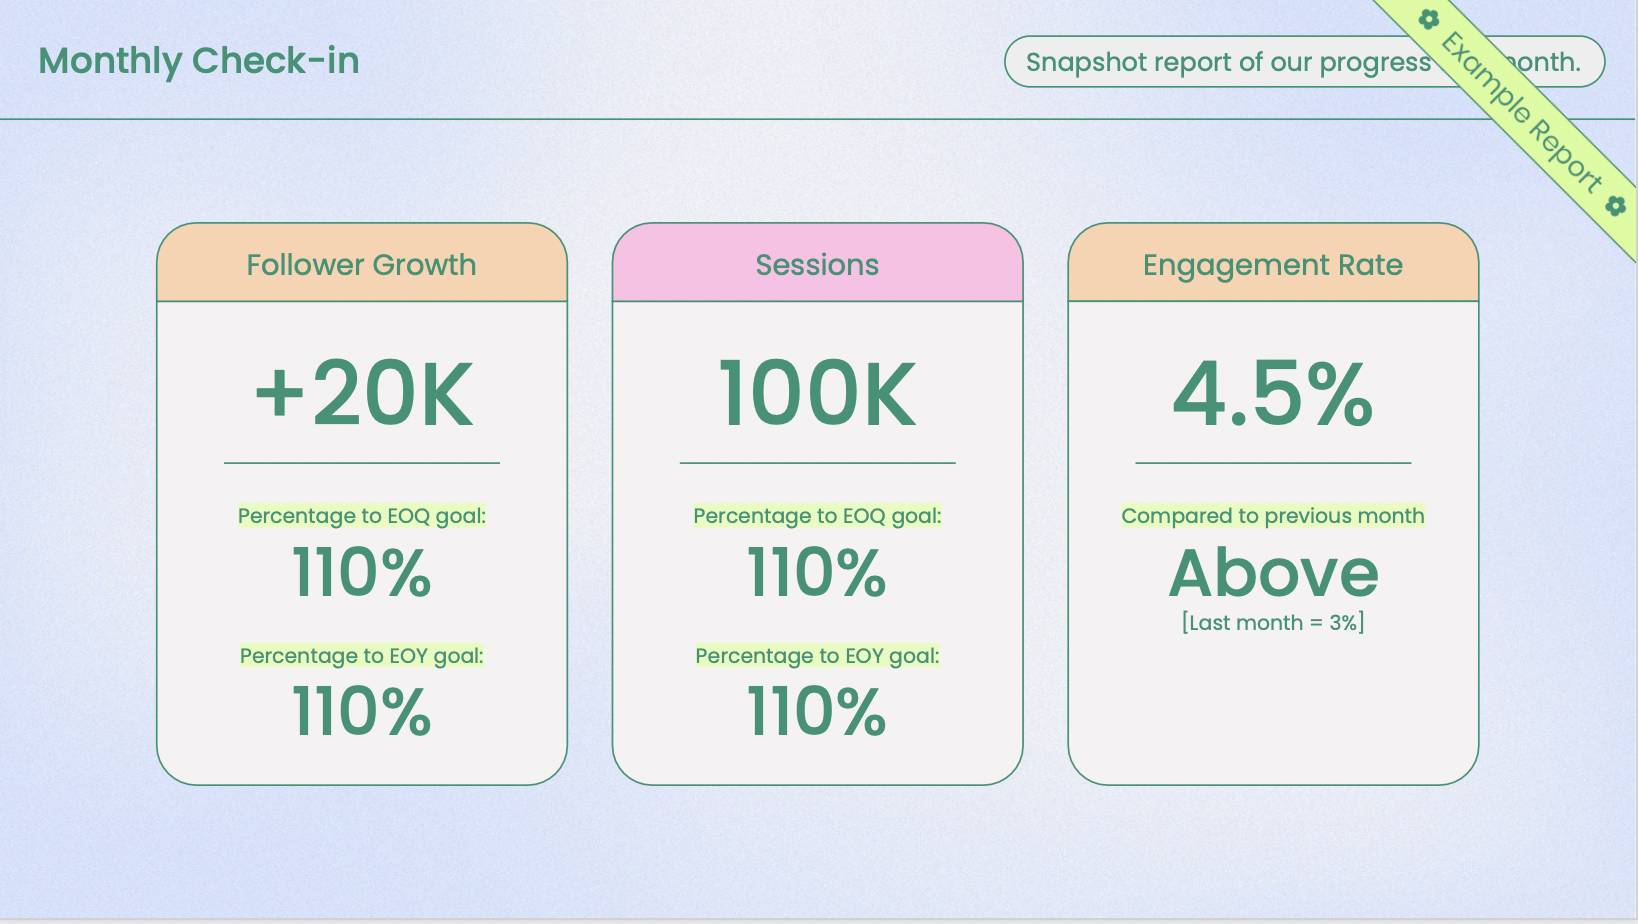
This shows a high-level overview of how you’re tracking toward your goals and can help inform your strategy for the months to follow.
Likewise, your top-performing posts slide will give more insight into what content drove the most sessions, got the most engagement, and reached the most people:
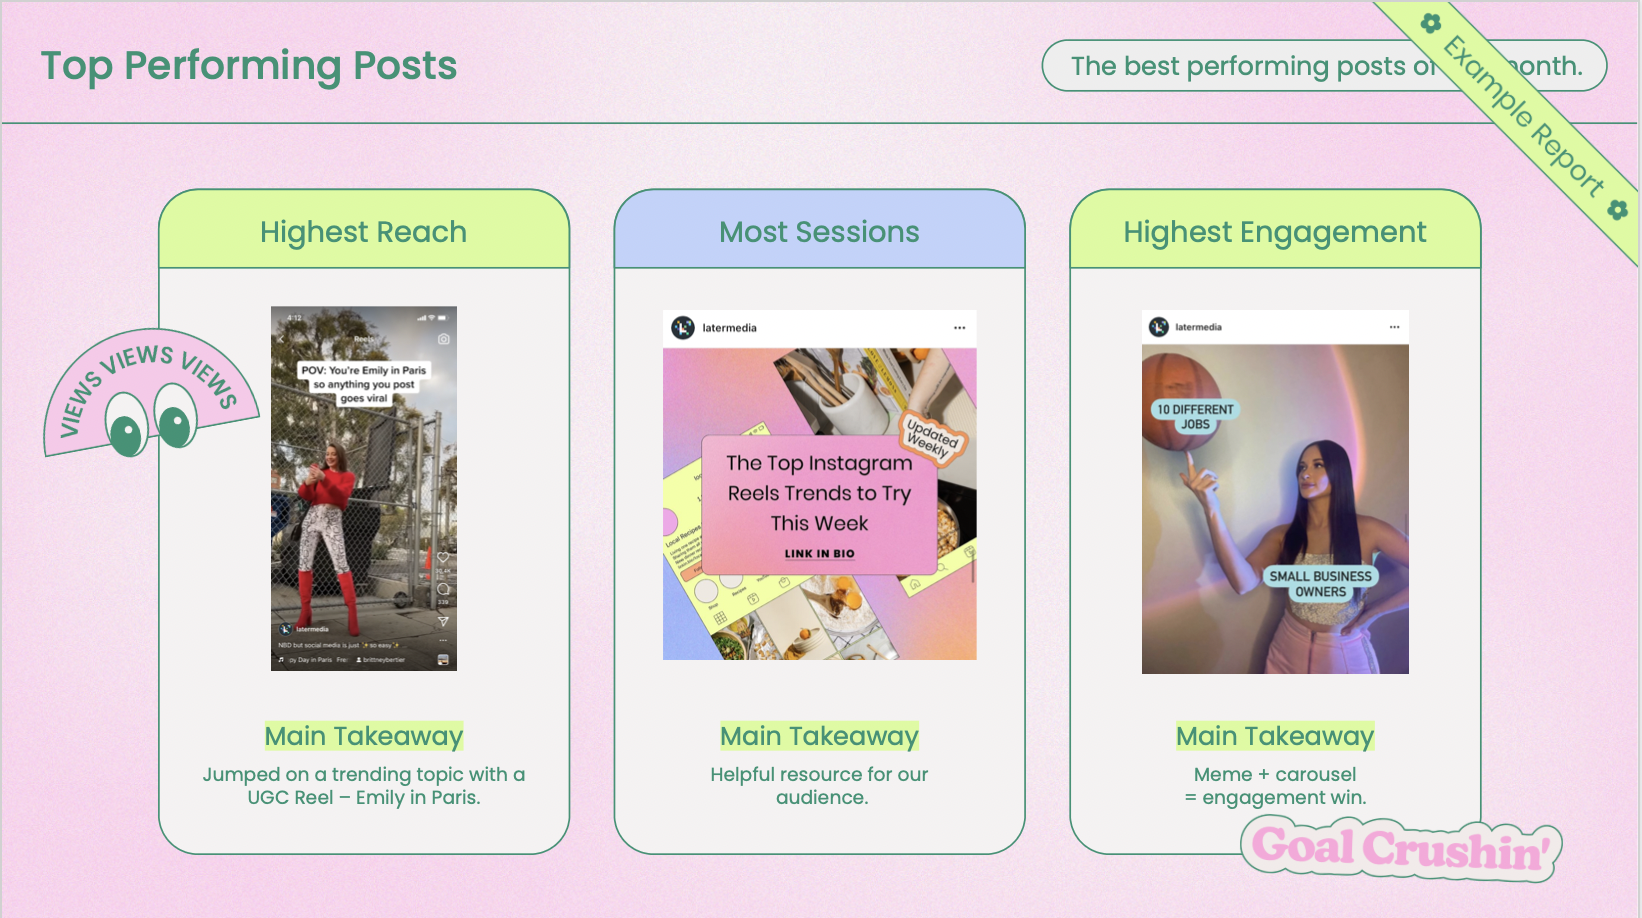
Here, you can briefly explain why each post performed so well, and call out any trends you notice.
For example, if the same post drove the most sessions and engagement, then you know you’ve hit the money spot.
Step #3: Monthly Performance Breakdowns & Metrics
Next, it’s time to add your social media analytics to the report.
Most social platforms have built-in analytics dashboards, but for more flexibility and peace of mind, you should keep track of your metrics in a spreadsheet that you own.
With Later, you can export your Instagram analytics from your dashboard as a CSV file directly to your desktop:
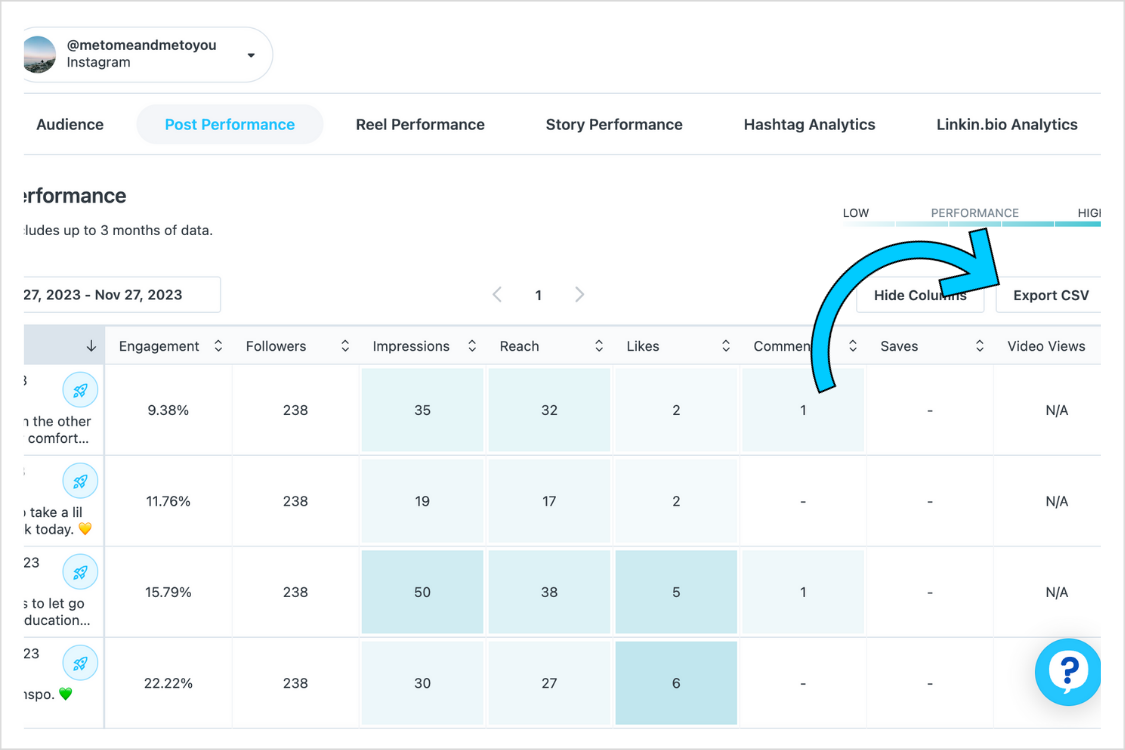
This will make it easier for you to see all of your data in a spreadsheet format, which you can then copy and paste into your report.
For the report template, we’ve separated the performance breakdown into three sections:
Instagram (Organic): Instagram, Instagram Stories, Instagram Reels
All Other Platforms (Organic): Facebook, Pinterest, Twitter, TikTok, YouTube, LinkedIn
Paid: Instagram, Facebook, Pinterest, Twitter, TikTok, LinkedIn, Google
Separating the data in this way will help you get a clear picture at first glance. It also lets you segment certain metrics for easier comparison.
For example, Instagram Reels should be analyzed separately from other content on Instagram (e.g. static feed posts) because the reach potential is so much higher.
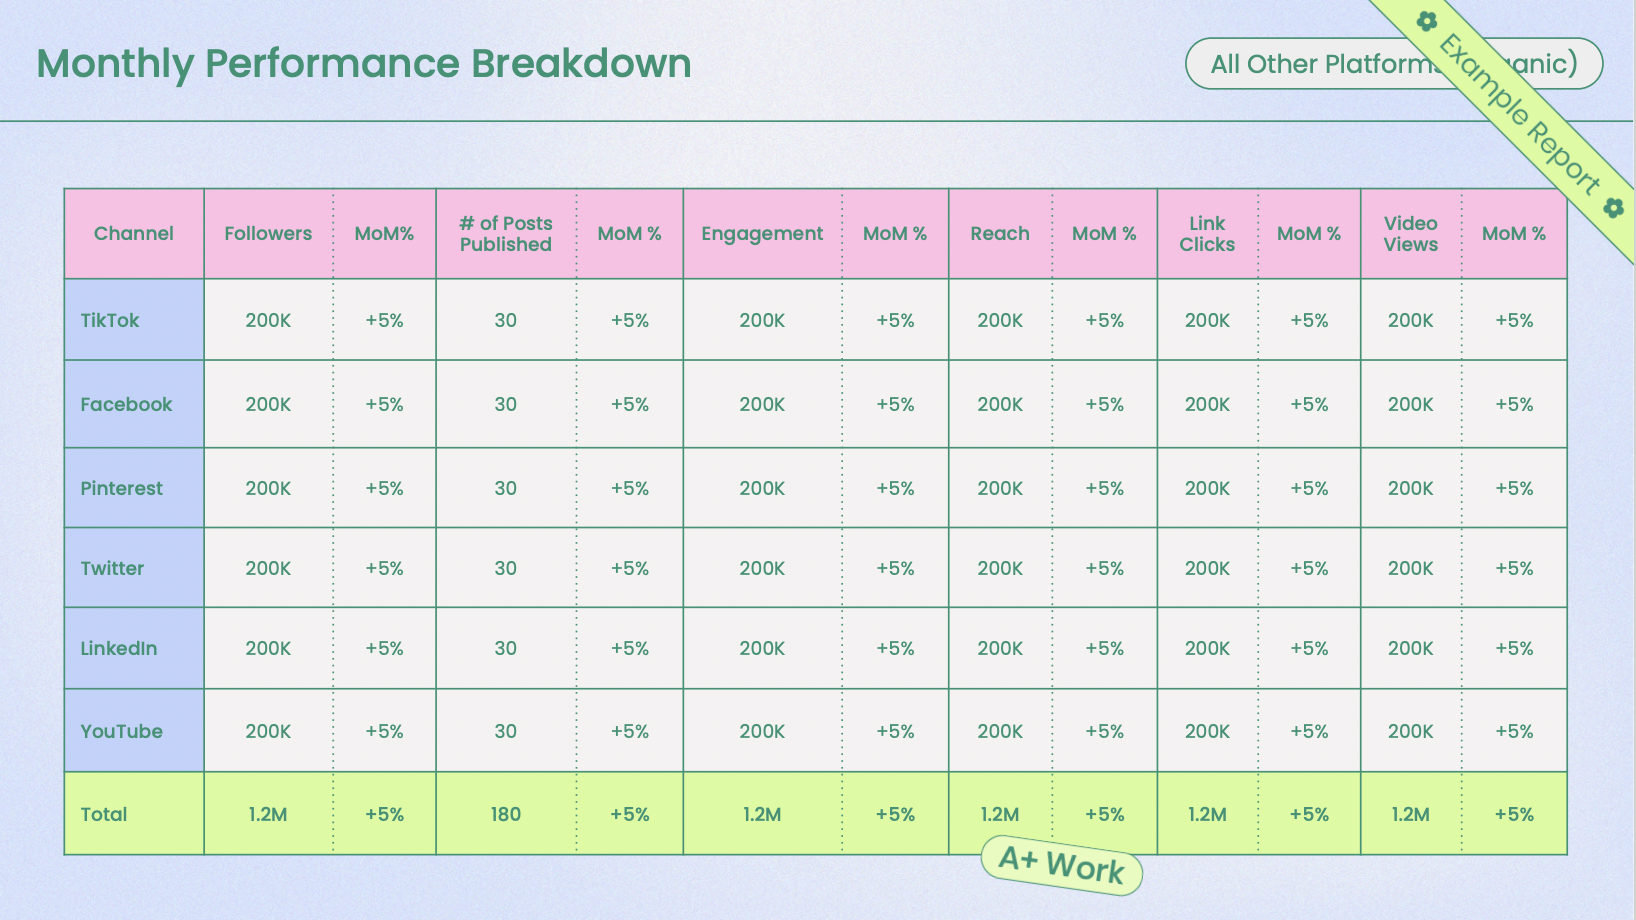
To calculate your monthly percent change, subtract the previous month from the current month. Then divide the result by the previous month and multiply by 100.
For example, if you had 436 Instagram followers in March and 562 followers in April, your equation should look like:
526 - 436 = 126
126/436 = 0.288
0.288 x 100 = 29%
This means that from March to April your Instagram profile grew by +29%.
Ready to level-up your performance tracking? Sign up to Later and explore your Analytics dashboard today.
Step #4: Summarize Your Key Learnings and Monthly Takeaways
To conclude your monthly report, it’s important to reflect on what worked and what didn’t — so you can drive your strategy forward:
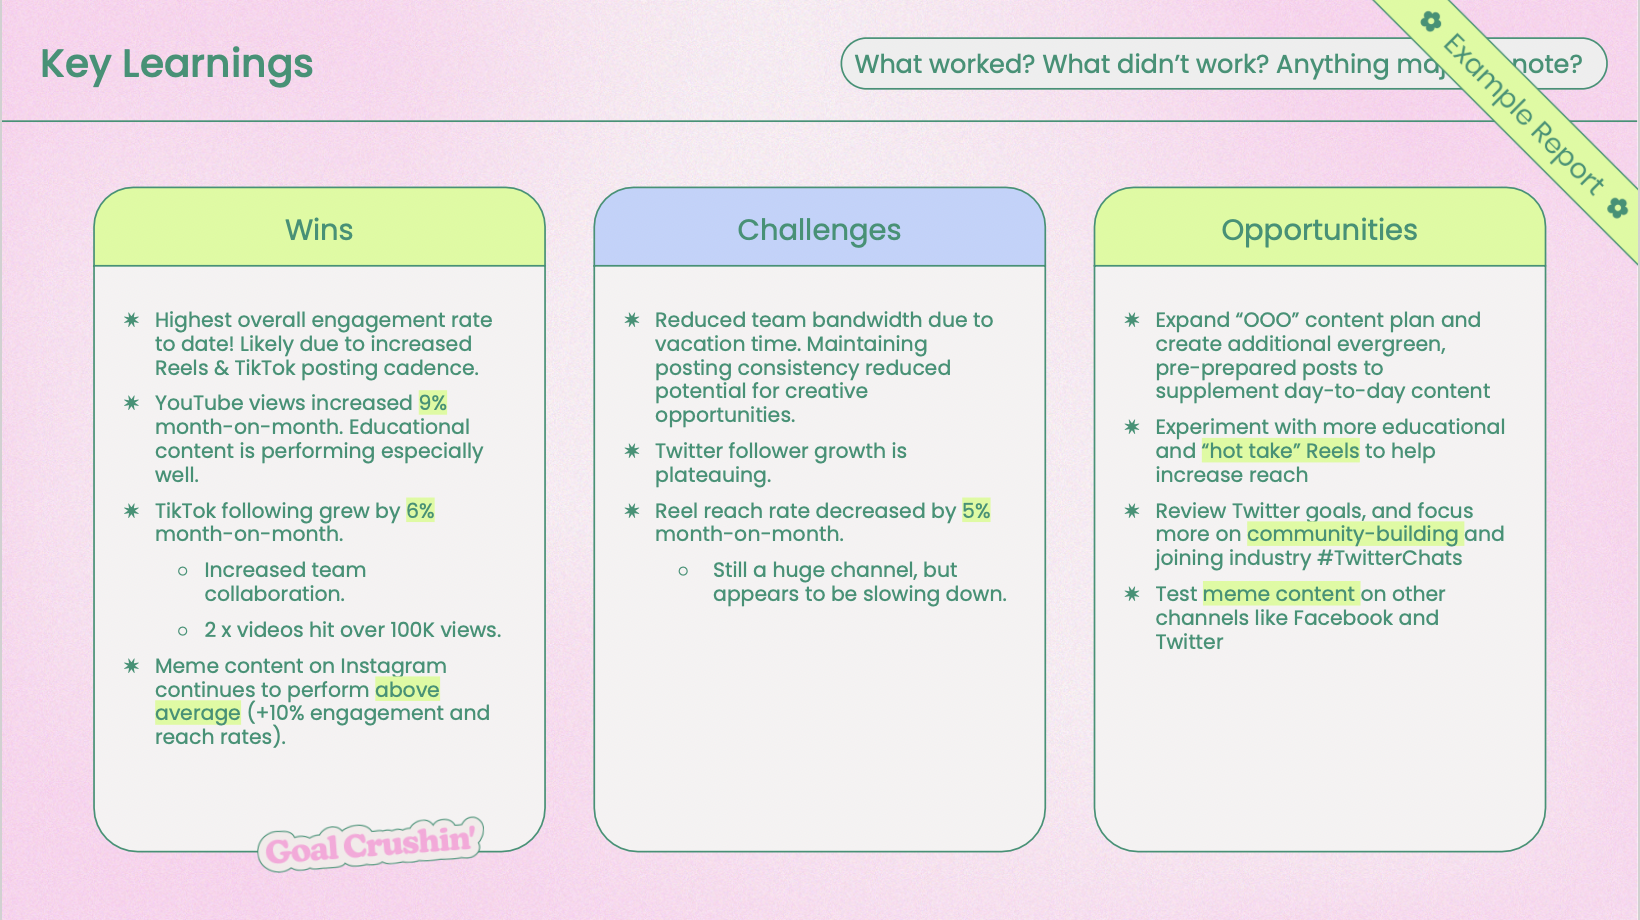
Wins: What worked this month? Did something perform exceptionally well?
Challenges: What didn’t land this month? This is a great time to present tweaks to your strategy. What can you try next month?
Opportunities: Share new platform features that you want to experiment with, upcoming holidays or events, or key learnings from your wins and challenges.
And there you have it, a step-by-step guide for creating your own monthly social media report.
Whether you’re presenting to senior leadership, giving a client update, or sharing with another department, you want your reports to be easy-to-read and easy-to-follow.
10s across the board.
Give your monthly reports a revamp with our free Social Media Report Template. It includes an example report and sticker pack too! Download now.
